|
|
 |
Back to Annual Meeting Program
Penetrating Atherosclerotic Ulcers and Saccular Aneurysms: Two Names for the Same Entity?
Eric K. Shang, M.D., Derek P. Nathan, MD, Shanna R. Sprinkle, BS, William W. Boonn, MD, Edward Y. Woo, MD, Grace J. Wang, MD, Ronald M. Fairman, MD, Benjamin M. Jackson, MD.
University of Pennsylvania, Philadelphia, PA, USA.
OBJECTIVES: The natural history of penetrating atherosclerotic ulcers(PAUs) is thought to include risk of aortic rupture, intramural hematoma, or saccular aortic aneurysm (SAA) development. However, the relationship and distinction between PAUs and SAAs is neither well described nor well defined.
METHODS: The radiology database at a single university hospital was searched for the computed tomographic (CT) diagnosis of SAA or PAU between 2003 and 2010. During this time, the interpreting radiologists lacked defined criteria for the radiologic diagnosis of either PAU or SAA. All scans were re-examined, and measurements of maximum transaortic diameter (MTD), neck diameter, lesion depth, and maximum sac diameter were measured. Evolution of SAA and PAUs were assessed using follow up CT, where available. All results are reported as mean ± standard deviation.
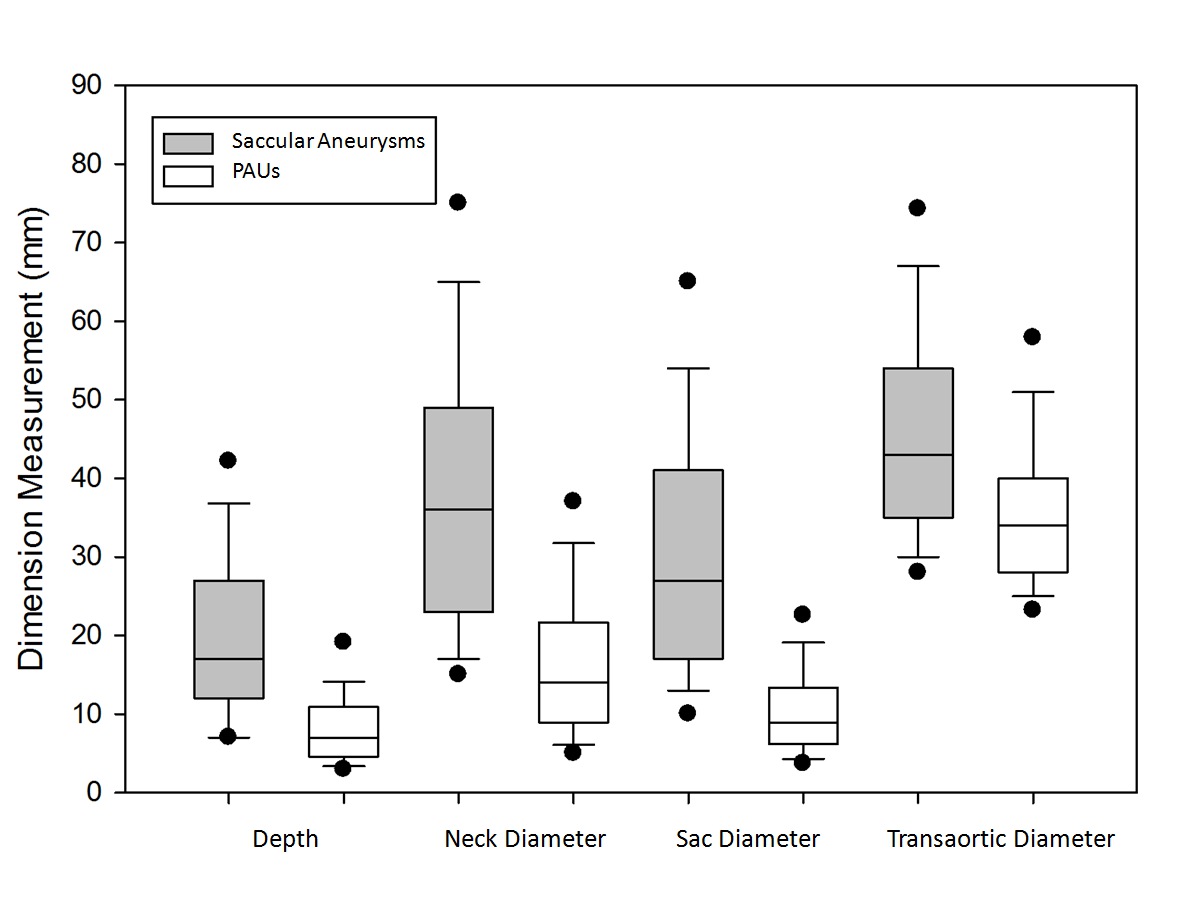
RESULTS: By radiology report, 280 penetrating atherosclerotic ulcers were identified in 262 individual patients, and 268 saccular aortic aneurysms were identified in 244 patients. Patients with SAAs were similar in age(73.5±10.0 vs 73.1±10.6 years, P=0.64) and gender (53.7% vs 60.0%, P=0.15) to patients with PAUs. SAAs had statistically significantly greater MTD than PAUs (50.1±16.3 vs 36.2±11.7 mm, P<0.001), as well as neck diameter (30.8±17.9 vs 10.7±7.2 mm, P<0.001), aneurysm depth (19.9±11.3 vs 8.3±5.4 mm, P<0.001), and maximum sac diameter (39.0±19.7 vs 16.8±10.8 mm, P<0.001). However, small SAAs and large PAUs showed significant overlap with respect to all of these dimensions (Figure). 50 SAAs (18.7%) and 49 PAUs (17.5%) had CT follow-up of at least 3 months. SAAs and PAUs did not have significantly different MTD growth rates (2.83±2.90 vs 2.0±1.7 mm/year, P=0.09). Similarly, MTD growth rates exhibited nearly identical relationships to initial aortic diameter (m1=0.101 vs m2=0.073, P=0.64 by ANCOVA).
CONCLUSIONS: While SAAs were in general found to be larger than PAUs, there was significant overlap in multiple morphologic measurements, as well as in growth rate. This suggests that SAAs and PAUs represent different points along a spectrum of atherosclerotic aortic disease, and are not distinct entities. If clinicians and radiologists aim to maintain distinct labels and management algorithms for PAUs and SAAs, standardized reporting should be established.

Back to Annual Meeting Program

|


