Back to Annual Symposium Program
A Robust Risk Predictive Model of Adverse Outcomes after Carotid Endartrectomy
Mohammad H. Eslami, MD1, Denis Rybin, MS2, Gheorghe Doros, PhD2, Alik Farber, MD1.
1Division of Vascular and Endovascular Surgery, Boston University School of Medicine, Boston, MA, USA, 2Division of Biostatistics, Boston University School of Public Health, Boston, MA, USA.
Introduction: The goal of our study was to construct and validate a robust risk prediction model for patients undergoing carotid endartrectomy (CEA).
Methods: Vascular Group of New England (VSGNE) and Vascular Quality Initiative (VQI) databases were queried for patients who underwent CEA. Pre-operative variables including age, gender, pre-admission living, diabetes, dialysis, history of congestive heart failure, coronary artery disease, peripheral arterial disease, use of statins, beta-blockers, urgency of the operation and symptomatic neurological status were entered into a logistic regression model as predictors of the composite adverse outcomes. Backward elimination (alpha level of 0.5) was then used to select a more parsimonious model. Calibration was performed to measure how closely predicted outcomes agree with observed outcomes. To assess calibration we used Hosmer-Lemeshow for dichotomous outcomes, R2 for continuous outcomes and a modified version of Hosmer-Lemeshow for time to event data. The predictive value of the model was assessed via C-statistic. The external validation was then performed using VQI sample after excluding those in VSGNE sample (VQI-VSGNE) following similar method. Chi-square test was used to compare the two groups.
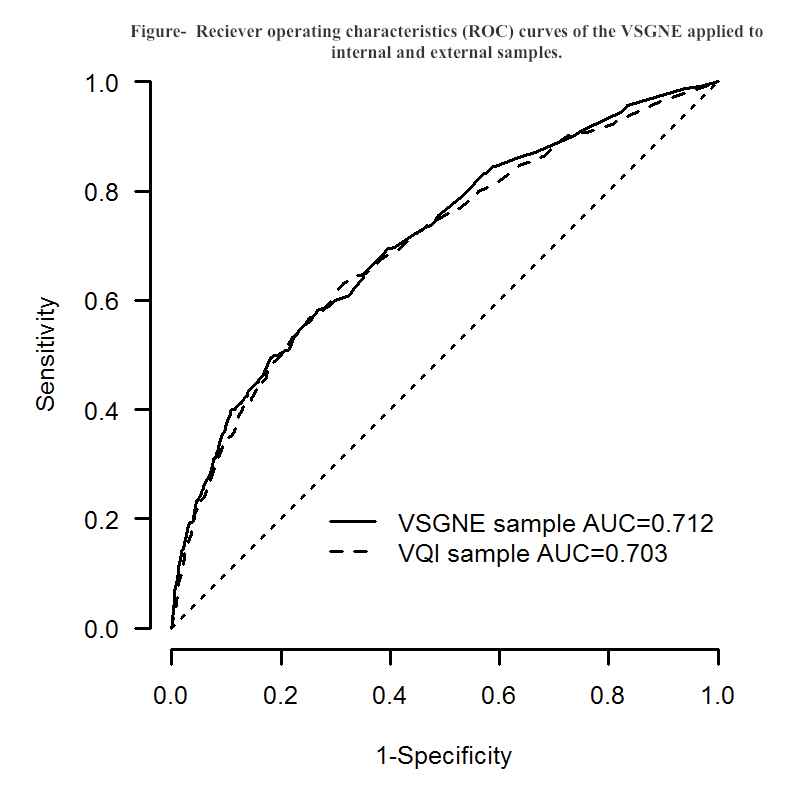
Results: A significantly higher rate of adverse outcomes was noted for the VQI sample (5.21%, n=12,075) compared with VSGNE sample (4.49%,n=8,661) (p<0.017). Table below summarizes the risk models in the VSGNE cohort. The discriminating ability of the model on the VSGNE is substantial (C=0.712) and the model fit is good (Hosmer-Lemeshow lack of fit test p=0.494). The discriminative ability of the VSGNE model remained substantial in the external data (VQI-VSGNE) (C=0.703) (Figure).
CONCLUSION: The internally validated VSGNE CEA risk model was externally validated by testing it against the remainder of VQI on patients who underwent CEA by a diverse array of physicians. This tool provides a simple and reliable method to risk stratify CEA patients using their pre-operative conditions. A risk score based on this model can reliably stratify patients according to their risk of adverse outcomes after CEA.
Table -VSGNE model: Parsimonious 0.5 level (C=0.712, Hosmer-Lemeshow p=0.494) | | | | | | Adj. Means Ratio | Lower Confidence Limit | Upper Confidence Limit | p value | | Age: 75+ vs. <75 | 1.6947 | 1.3720 | 2.0933 | <0.0001 | | Male vs. Female | 0.9011 | 0.7284 | 1.1148 | 0.3374 | | Pre admission: Nursing Home vs. Home | 7.7144 | 4.7317 | 12.5773 | <0.0001 | | Diabetes | 1.3992 | 1.1256 | 1.7393 | 0.0025 | | Congestive heart failure | 1.5379 | 1.1220 | 2.1079 | 0.0075 | | Peripheral arterial disease | 1.2545 | 0.9892 | 1.5909 | 0.0614 | | [[Unsupported Character - Symbol Font β]]-blockers | 1.2277 | 0.9367 | 1.6092 | 0.1372 | | Symptomatic | 2.0953 | 1.6734 | 2.6235 | <0.0001 | | Urgent vs. Elective | 2.8054 | 2.1790 | 3.6118 | <0.0001 |
Back to Annual Symposium Program

|
