|
Back to 2016 Karmody Posters
Pilot Study Assessing Tissue Perfusion in Peripheral Arterial Disease using 2D Color-Coded Digital Subtraction Angiography
Ann Kim, MD1, Andrew Shevitz, BS2, Daniel Kendrick, MD1, Virginia Wong, MD1, Karem Harth, MD1, Henry Baele, MD1, Vikram Kashyap, MD1.
1Division of Vascular Surgery, University Hospitals Case Medical Center, Cleveland, OH, USA, 2Department of Physiology and Biophysics, Case Western Reserve University, Cleveland, OH, USA.
OBJECTIVES:
Contrast angiography with digital subtraction (DSA) has been considered the gold standard in visualizing peripheral arteries. However, this modality is only qualitative in delineating flow in small vessels and perfusion to distal tissue. A real-time imaging software was used to extrapolate tissue perfusion parameters from standard DSA images. The purpose of this study is to determine the feasibility of using 2D flow parameters in order to stratify patients with peripheral arterial disease (PAD).
METHODS:
Selected patients with known peripheral arterial disease who were scheduled to undergo a lower extremity (LE) angiography were enrolled at our institution over a five month period. A pre-operative ankle-brachial index (ABI) was recorded. 2D perfusion DSA images (Philips, Inc.) were captured while keeping the catheter position, contrast injection settings, and foot position constant. If applicable, post-intervention 2D images and ABIs were also acquired. In our analysis, we defined the vessels passing through the ankle as a region of interest (ROI) and compared these flow parameters to the patient’s ABI.
RESULTS:
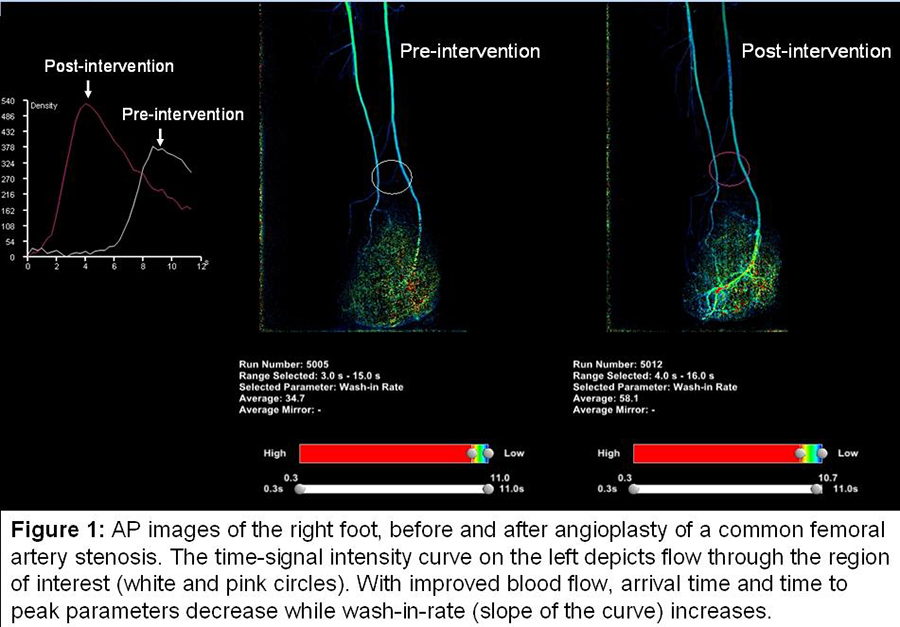
This study enrolled 13 patients, capturing a total of 9 diagnostic LE angiographies and 5 LE angiographies with intervention. With worsening PAD (ABI < 0.9), there is a detectable difference in signal intensity (SI) and 2D flow parameters. Severely diseased arteries had prolonged average arrival time of 3.8 secs, average wash-in rate of 41.2 SI/secs, average time to peak contrast intensity of 3.6 secs, as well as average amount of contrast flowing through the ROI (area under the curve) of 5416.9 SI*secs. Arrival time correlated best with ABI (R2= 0.42). Larger changes in perfusion parameters (10-20%) following an intervention (figure 1) also corresponded to marked improvements in ABI, n=2 patients.
CONCLUSIONS:
2D imaging during diagnostic angiography is a promising technique that provides quantitative data on foot perfusion. Further studies are warranted to validate it as a clinically useful adjunct to angiography in patients with PAD.
Back to 2016 Karmody Posters
|


