|
Back to 2016 Karmody Posters
Computational Fluid Dynamics to Evaluate Hemodynamics of Saccular Aortic Disease
Arnoud V. Kamman, MD1, Rodrigo Romarowski2, Simone Morganti, PhD2, Michele Conti, PhD2, Francesco Secchi, MD1, Francesco Sardanelli, MD1, Frans L. Moll, MD, PhD3, Joost A. van Herwaarden, MD, PhD3, Ferdinando Auricchio, PhD2, Santi Trimarchi, MD, PhD1.
1Policlinico San Donato, San Donato Milanese, Italy, 2University of Pavia, Pavia, Italy, 3University of Utrecht, Utrecht, Netherlands.
OBJECTIVES: Computational Fluid Dynamics (CFD) offers detailed visualization and quantification of cardiovascular hemodynamics. Our objective was to use this imaging technology for investigating saccular thoracic aortic lesions with different volumetric dimensions.
METHODS: Three patients from our CFD database were included. One patient with a posttraumatic aortic aneurysm (P1, Figure 1A), one with three separate aortic lesions (P2, Figure 1B) and one with a penetrating aortic ulcer (PAU) (P3, Figure 1C). Using CFD, we calculated time averaged wall shear stress (TAWSS), defined as wall shear stress during one cardiac cycle, measured in dynes/cm2 (one dyne is equal to 10 micronewtons), and flow velocity measured in cm/s. The average TAWSS and flow velocity for each saccular lesion were compared among them, as well as to the non-dilated aorta. Flow patterns were visually assessed.
RESULTS: Lesion volume was 88.28 mm3 in P1, 42.48 mm3 (proximal)/43.61 mm3 (middle)/70.20 mm3 (distal) in P2 and 9.26 mm3 in P3. In P1 and P3, the TAWSS was lower compared to the non-dilated aorta (7.37 dynes/cm2 vs. 11.36 dynes/cm2 and 3.16 dynes/cm2 vs. 4.28 dynes/cm2); while in P2 the TAWSS was higher within the lesions (3.85/6.03/4.82 dynes/cm2 vs. 3.51 dynes/cm2). Blood flow velocity in the lesions in P1 and P3 was lower compared to the non-dilated aorta (25.87 cm/s vs. 92.13 cm/s and 23.31 cm/s vs. 62.11 cm/s, respectively). In P2, the velocity was almost similar to the non-dilated aorta (34.23/35.16/34.97 cm/s vs. 40.57 cm/s). Blood flow patterns were laminar in non-dilated aortic sections, while in all lesions a turbulent configuration was observed.
CONCLUSIONS: By using CFD, clear hemodynamic differences between three morphologically different saccular aortic diseases became evident. This study demonstrated that CFD could provide additional information to complement regular imaging modalities. In the future, the specific translational impact of CFD will be clarified, as to improve its practicality in clinical practice. 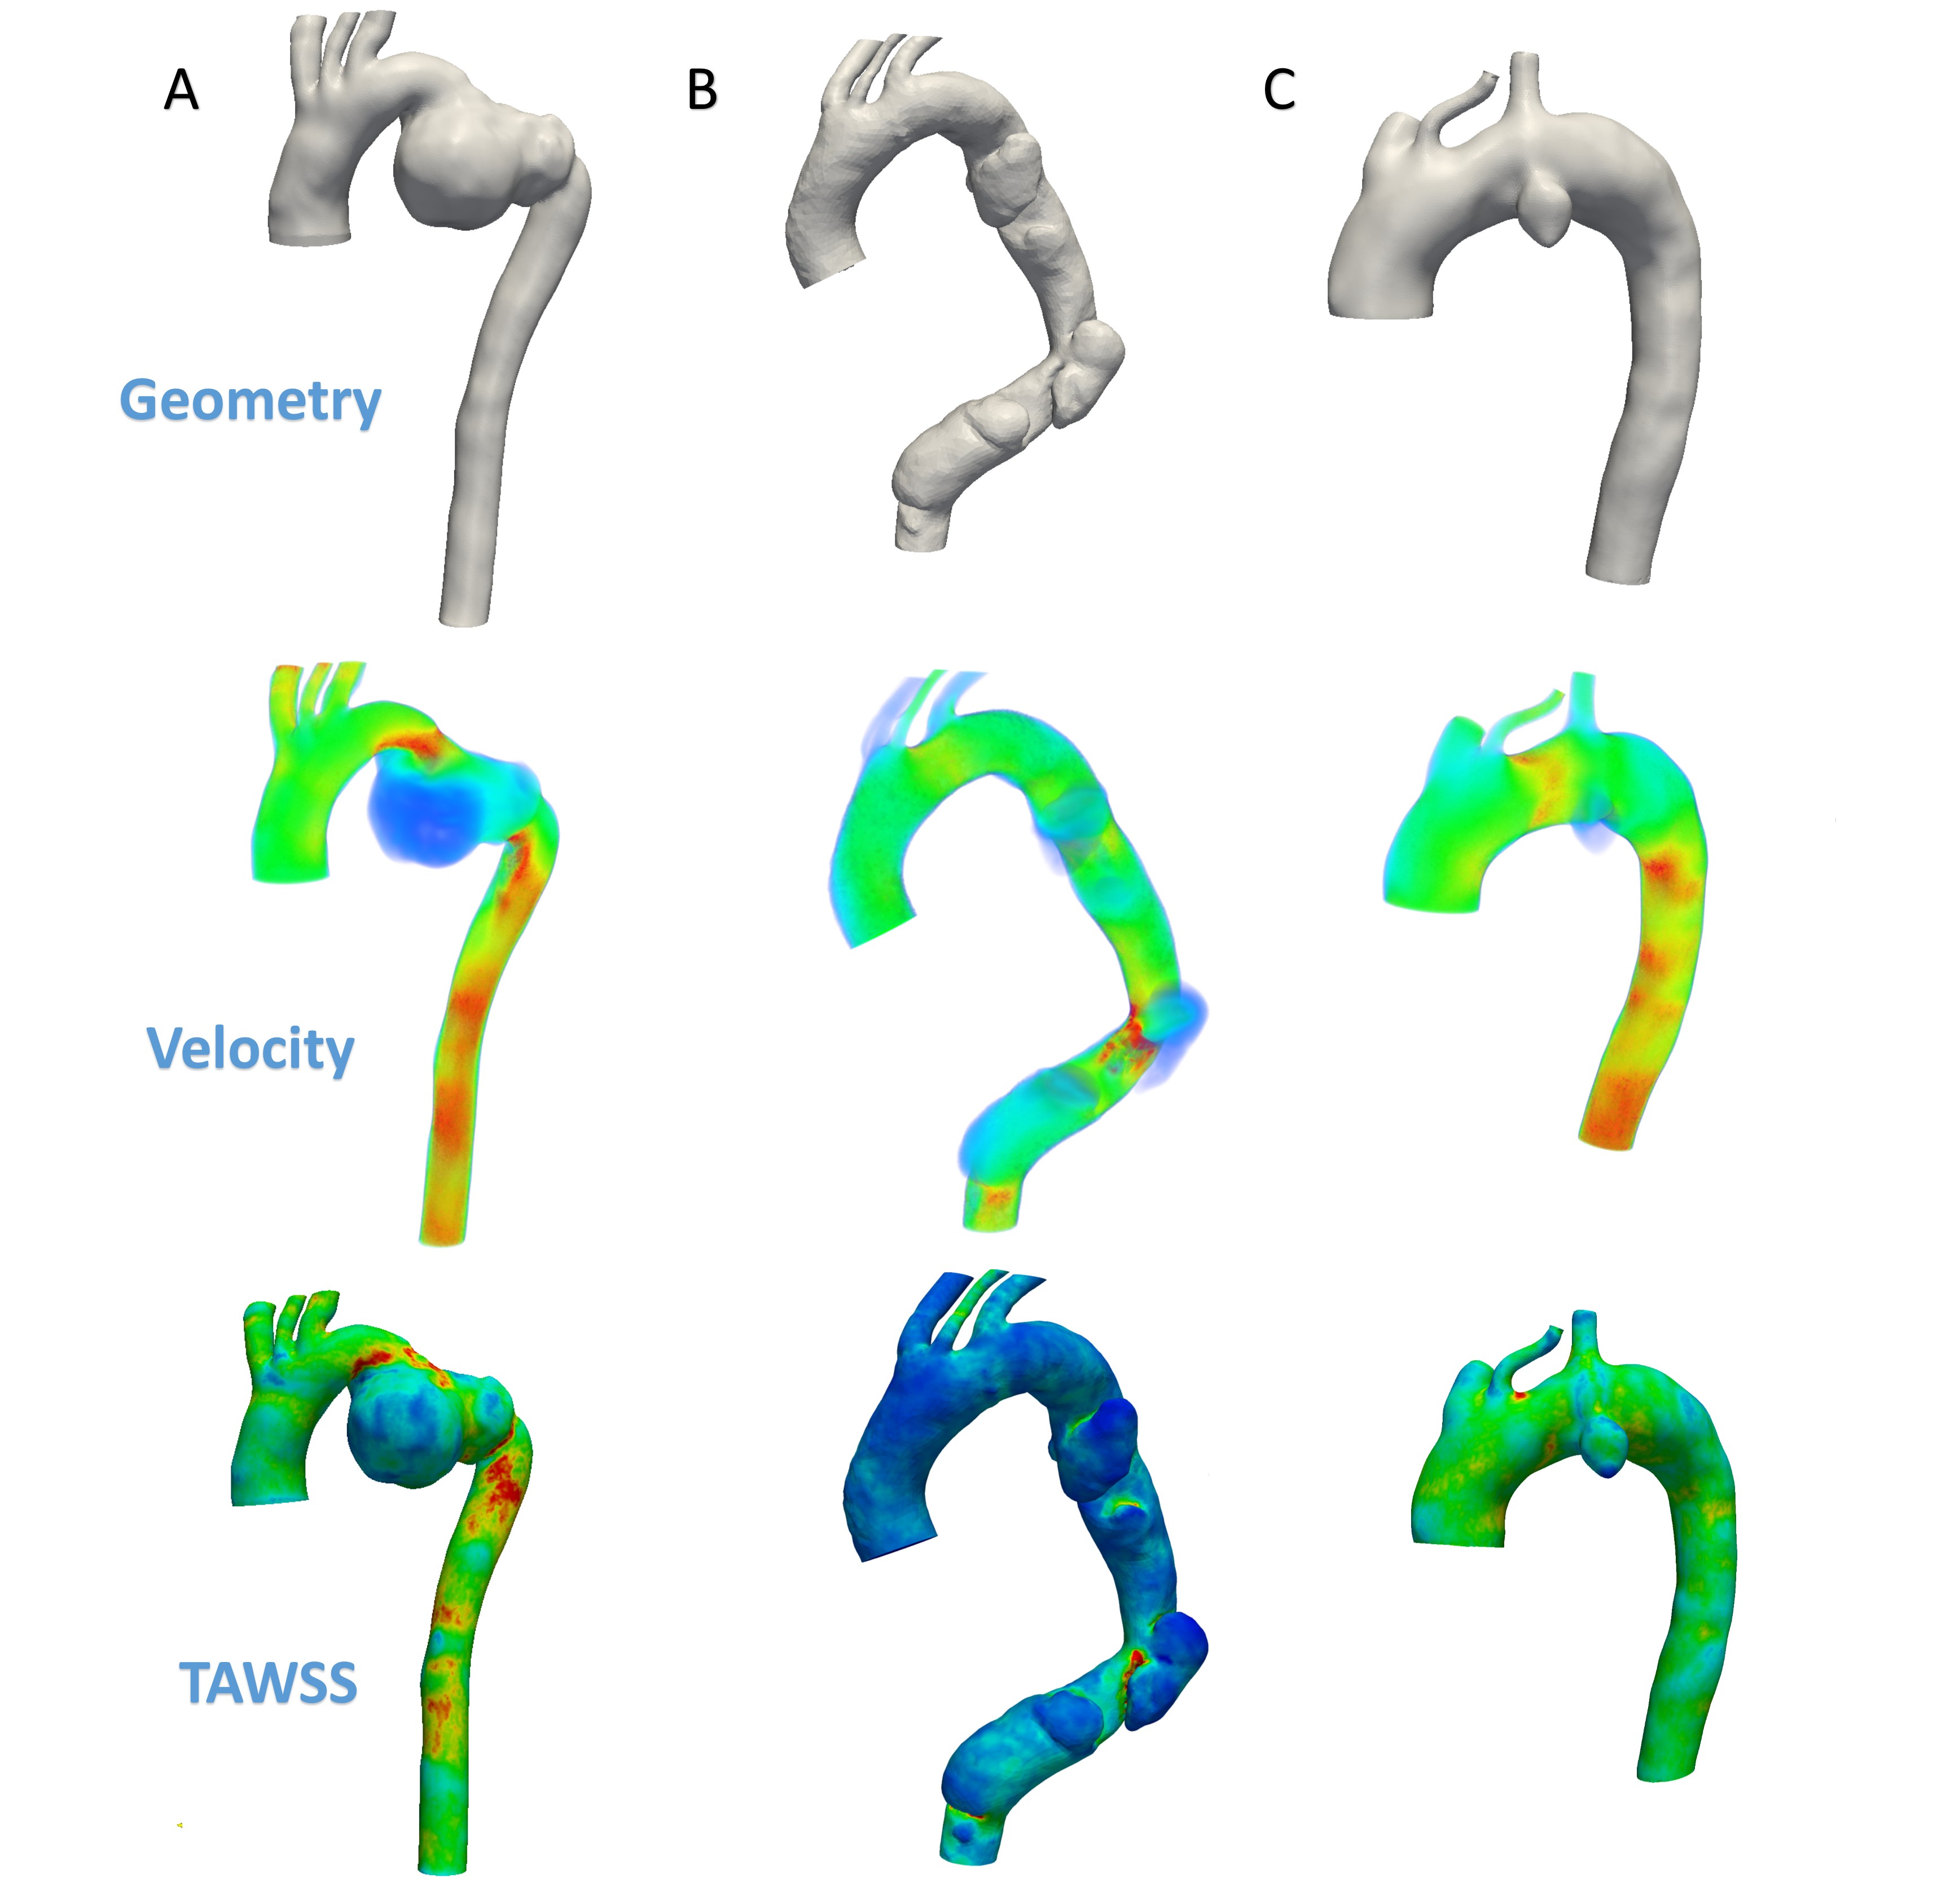
Back to 2016 Karmody Posters
|


