
Machine Learning of Continuous Wave Form Doppler Signals
Serge Assaad, Mark Chen, Guangshen Ma, Brian Gilmore, M.D., Cynthia K. Shortell, M.D., Wilkins Aquino, PhD, Leila Mureebe, M.D..
Duke University, Durham, NC, USA.
Objective - Although Continuous Wave Doppler (CWD) devices are commonly used at point-of-care to examine patients’ vasculature, most users of these devices do not receive training regarding their proper use or the interpretation of CWD audio output. We hypothesize that a machine-learning algorithm will improve interpretation of CWD signals. Methods - We collected audio recordings of pedal CWD signals from 38 patients. We acquired 5 audio samples from one tibial artery from each patient (190 individual recordings). Each recording was classified as healthy or unhealthy based on the interpretation by the vascular laboratory. An iterative approach of developing the signal classifier was taken as follows: (1) extraction of relevant features from the signals in both time domain and frequency domain, (2) building of classifiers (k-nearest neighbors, support vector machines, linear discriminant analysis, gradient boosting, and Naďve Bayes) based on the extracted features to classify signals, and (3) evaluation of the performance of the model and the feature subset using 10-fold cross-validation (CV) coupled with 2 outcome metrics: Receiver Operator Curve (Area Under the Curve, AUC) and percent accuracy. Results - Using the first metric, the optimal AUC is 0.90 (out of 1.00) using the 3-Nearest-Neighbor classifier coupled with the following list of features: mean frequency, peak frequency, power, total harmonic distortion (THD), resistivity index (RI), systolic/diastolic ratio (SDR), and rise/decay time ratio (RDTR). Using the second metric, the optimal percent accuracy is 92% using the 4-Nearest-Neighbor classifier coupled with these features: peak frequency, THD, SDR, rise/mean time ratio (RMTR) (figure). Principal Component Analysis showed that the first 2 principal components explained 97.2% of the data’s variance, and showed a separation of the 2 classes in the feature space. Conclusions - We demonstrate that machine learning can be successfully applied to audio CWD data. This can create clinical decision support to improve the utility of CWD at the point of care, reducing time to diagnosis or triage decisions.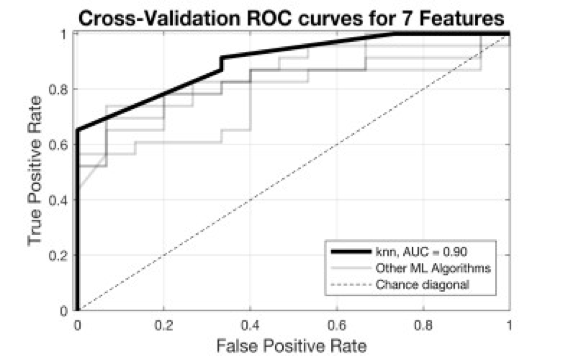
Back to 2018 ePosters


